
How to Size Relative TSR Grants with a Stub Period
September 16, 2021
One of the imperfect challenges of relative total shareholder return (RTSR) programs can be the existence of “stub periods.” As a quick background, it is common to see RTSR awards granted approximately in March or April, but yet have a performance period that began on January 1, therefore granting the awards with over two months of TSR outcomes already known. I define this small period of time as a “stub period,” and it has an outsized impact on the final accounting valuation under ASC 718. (CJ Van Ostenbridge and Carly Sanfilipo of Infinite Equity explain the effect of stub periods and some potential alternatives on how to mitigate them in the article “The ‘Stub Period’ Challenge”).
That being said, implementing alternatives to mitigate a stub period can be awkward, and sometimes not even possible dependent on compensation committee practices. Therefore, in many cases, companies must live with the challenging effect of a stub period. If this is the case, companies need to be cautious on the approach to determining grant sizes. To provide a quick illustration, let us think about the following case study.
Case Study: Relative TSR Awards
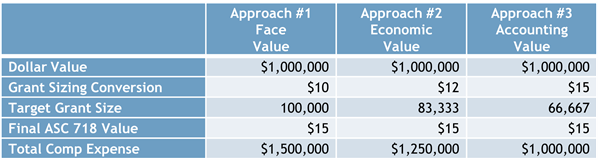
Company ABC grants $1,000,000 in performance awards tied to RTSR from January 1, 2022, to December 31, 2024. The grant is approved on March 1, 2022, when the stock price is $10. When designing the new performance plan back in December 2021, Company ABC had performed an estimate of the fair value under ASC 718 using the Monte Carlo simulation, which was $12. During the stub period, Company ABC greatly outperforms its peers. Yay, I think? Because of this, the accounting valuation on March 1, 2022, equals $15, significantly higher than the company’s original estimate. The table below illustrates the effect on the grant size, using three alternative approaches.
Face Value vs. Fair Value
The 2019 NASPP/Deloitte Consulting Domestic Stock Plan Design survey reports on two prevalent practices for determining grant size: 1) face value (approach #1 in the case study), and 2) fair value (approach #3). Speaking from my experience as a practitioner, fair value in the NASPP/Deloitte Consulting survey is virtually always the accounting fair value under ASC 718. According to the survey, only 28% of respondents use the Monte Carlo simulation to determine grant size, while 72% use the face value (or some derivative of it, like an averaging period up front). Broadly speaking, I believe the face value approach to be straightforward and conceptually intuitive for plan participants to understand.
Accounting Value vs. Economic Value
For those companies that use the award fair value to determine the size, I generally have a strong dislike for the “accounting value” approach. I struggle philosophically with the very perverse outcome of a company outperforming its peers during the January and February months and being rewarded with a smaller grant size. In this example, the executive would get 66,667 target awards (rather than 100,000), and effectively decrease their award size by 33%—because they theoretically performed well. Really? And the same perverse outcome would occur on the downside, so that if a stock underperformed for January and February, the executive would be “rewarded” with a larger grant size. This is a TERRIBLE outcome in a design.
As an alternative to using the accounting value, I recommend considering the “economic value” for grant sizing. This value represents the true value of the award, without any of the known TSR information during the performance period but considers all the specific design provisions otherwise. I believe this accurately reflects the value of the instrument, without punishing or rewarding the employees for performance during the stub period.
Note that the economic value isn’t all roses, as there are a couple of challenges also. For example, the disclosed accounting value in the Summary Compensation Table of the proxy statement will not match the value the compensation committee intended. However, in my opinion, it is time for companies to start using better—and more fair— approaches to determine grant sizes especially for companies with relative TSR and stub periods.
Expense Amortization
For completeness here, we can’t forget to mention the expense amortization of the award. Even though the performance period begins (January 1, 2022) before the accounting grant date (March 1, 2022) in our example, the expense recognition would begin on the accounting grant date (ignoring the stub period) and be straight-lined through the end of the requisite service period, therefore amortized over approximately 34 months in this example.
-

By Terry Adamson(aka Mr. Relative TSR)
Infinite Equity